
In calendar 2024, the Dow Jones Industrial Average gained 12.9%, the Standard and Poor’s 500 Index added 23.3% and the Nasdaq Composite surged 28.6%. These excellent returns were eerily similar to the previous year (2023) when the Dow Jones Industrial Average added 13.7%, the Standard and Poor’s 500 Index gained 24.2% and the Nasdaq Composite rocketed up 43.4%. The back-to-back +20% annual gain in the S&P 500 is unusual: it has not happened in the last twenty-five years. Returns have been so salutary for the last two years that many investors have forgotten the bloody nose that was 2022, when the S&P 500 fell 19.4%, the Nasdaq plummeted 33.1%. and the 10-year Treasury bond lost 17.8%. Don’t forget. Don’t obsess about it, but don’t forget. In any given year, equity returns represent a fickle combination of business fundamentals and investor psychology. Business fundamentals are a constantly changing and evolving target. Investor psychology is…well, Thanksgiving dinner at your cousins’ house: just because it was calm and pleasant last year does not mean it won’t be a shout-fest this year. And, no, it does not matter how perfectly the turkey was prepared.
In December, The Conference Board reported that 57% of consumers expected higher stock prices over the next twelve months. This was the highest percentage since at least 1987, and was a stark contrast with the 25% of consumers who foresaw higher stock prices in mid-2022, as inflation rates peaked. The chart below needs some explanation:
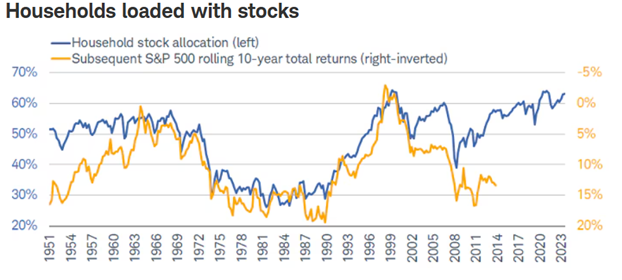
The chart overlays household equity allocation amounts with realized annual 10-year total stock returns. The blue line represents stock allocation, with the allocation percentage on the left. The yellow line represents the actual annualized 10-year equity return, with the return numbers posted on the right in yellow. Note that the total return numbers are inverted, with the lowest returns at the top of the chart. The takeaway is that high household equity allocations usually preview mediocre returns. Low household stock allocations usually preview good long-term returns. Like the currently elevated Conference Board expectations survey, high household stock allocations have been a contrary indicator historically. Bond allocations are prudent in portfolios.
Speaking of bonds, the Federal Reserve cut the Federal funds rate by 100 basis points in 2024 starting in September, intending to forestall a slowing economy. Two interesting things happened. First, the economy showed little sign of cooling, with solid employment numbers and continued economic growth. Then, the second interesting thing happened (see below):
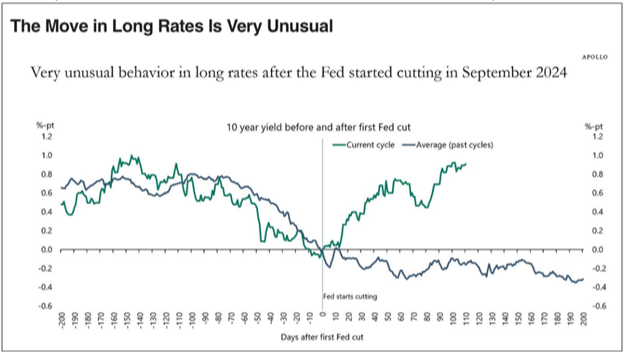
Usually when the Fed cuts short-term rates, longer-term interest rates fall as well. The August decline in inflation and rise in unemployment that caused the Federal Reserve to cut, reversed in the latter months of 2024. The bond market reacted to the premature rate cut by demanding greater interest rates on longer-term paper. The Fed has now paused its easing cycle, and bondholders are more vigilant about inflation. This is good for fixed income investors. We believe that Chairman Powell will be very measured in cutting rates during 2025.
One of the more important factors that has likely influenced the Federal Reserve’s interest rate policy over the last two years is the inverted yield curve. An inverted yield curve is traditionally defined as when 3-month Treasury bill interest rates exceed the interest rate offered by the 10-year Treasury note. Historically, an inverted yield curve has been a very reliable leading indicator of an impending recession. Although lead times vary widely, an inverted yield curve has signaled eleven of the last twelve recessions. Heretofore, the inverted yield curve of October 2022 through December 2024 has not predicted a recession. Historically, the yield curve inverts as the Fed raises short-term rates to cool down an overheating economy. Then, the yield curve un-inverts as either the economy cools, the Fed eases or both. It is possible that this time the Fed cut rates to relieve stress on the banking system’s deposit liability positioning, rather than to cool down an overheating economy. It is also likely that the Fed’s interest rate hikes were a belated response to an overly dovish interest rate policy. Arguably, the rate cuts of last year returned interest rate policy to a dovish position, as real interest rates only turned positive in late-2024 and today only stand at 66% of the average real interest rate of the 1958-2024 period. It should be noted that during the last four inversion cycles, the yield curve un-inverted before a recession began, with an average lag of six months. That time-frame would take us to approximately June 2025.
We were planning to write about market concentration next quarter, but today’s implosion of Nvidia changed our schedule. The proximate cause of Nvidia’s loss of $590 billion of market value was the emergence of a competitive Chinese Artificial Intelligence model that was developed using a fraction of the computing power of its rivals. This called into question both Nvidia’s business model and the financial prospects of its largest customers, i.e. Alphabet, Microsoft, Amazon and Meta. It also highlights market concentration. In 1996, the ten largest companies in the S&P 500 Index comprised 17% of its total market capitalization. By last year, the ten largest companies accounted for 39%. Market returns have been dominated by a few companies, notably the so-called Magnificent Seven (Meta, Microsoft, Alphabet, Amazon, Nvidia, Tesla and Apple).
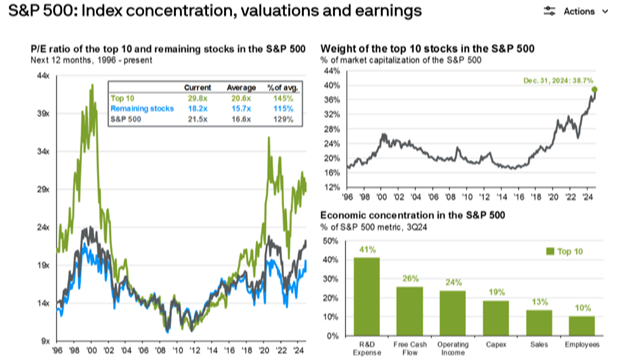
The chart above, from JPMorgan, nicely portrays the economic concentration of the ten largest companies in the S&P 500 Index. As a group, they carry much higher valuations than the rest of the constituents of the Index. Admittedly, they also have better business fundamentals (historic growth rates, operating margins, returns on investment) than the other S&P 500 constituents. If we look only at the Magnificent Seven, in the last four years they have been responsible for 33%, 56%, 63% and 55% of the S&P 500 Index’s price returns, respectively. The concentration is exacerbated when you consider that, arguably, five of the seven are relying heavily on the same business model bet: an Artificial Intelligence world model that will not only be transformational, but vastly profitable. DeepSeek’s apparent breakthrough throws the latter assumption into question.
After two years of excellent equity market returns, we try to maintain balance. Tariffs, tax rates and interest rates will likely churn markets in the future. Real diversification will protect portfolios, and bonds are once again part of that model. Only patience and planning can create wealth.